 Subscribe
0
Correction: Maximizing Compounded Rate of Return
A few readers pointed out a typo and an arithmetic error in my article "Maximizing Compounded Rate of Return". In the geometric random walk example where the stock can go up or down 1% at every step, the mean rate of return m is 0%, (not 1%), and the compounded rate of return is -0.005% (not -0.5%). My sincere thanks to all my readers who mercilessly scrutinize my ideas and check my numbers!
0
Reader suggested a possible trading strategy with the GLD - GDX spread
Steve Hansen of Raymond James Ltd. in Vancouver, B.C. suggested to me that a good trading signal for the GLD - GDX spread is when it exceeds 2 standard deviations from its mean. He observed that these are roughly at +/- $250 based on my definition of the spread, and that there were 3 such (immensely profitable) signals since the inception of GDX. Here is Mr. Hansen's plot:
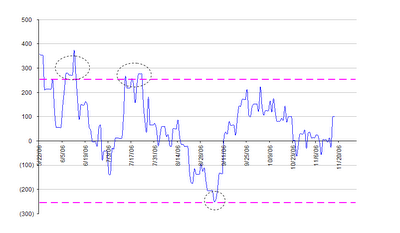
This certainly looks like a fairly safe strategy. Of course, if one desires more frequent signals, one can always enter into smaller positions at smaller spread values.
By the way, just when we were celebrating the reversion of the GLD - GDX spread this morning, the QM - XLE spread plunged to another multi-year low. With crude oil prices down about 30% from its all-time-high, XLE, the energy stocks ETF, is still within 5% of its all-time high. Does this make any sense? We shall see after this quarter's earnings from the oil companies are announced ...
0
GLD-GDX spread reverted to 0 this morning
Just a quick note on the GLD-GDX spread that I have been talking about. This morning (Nov 17) the negative spread completely reverted and has gone into positive territory.
0
An updated analysis of the arbitrage between gold and gold-miners
In my article about the arbitrage opportunity between gold and gold-miners, I cautioned that we should take the analysis with a grain of salt because of the short history of GDX (a gold-miners ETF). Adam Phillips of Van Eck Global, the firm which created GDX, has kindly pointed out to me that GDX is designed to track the Amex Gold Miners Index, GDM, which has a much longer history. Hence I repeated the analysis with gold spot prices vs. GDM for the last 3 years. The results confirm my earlier analysis with much higher statistical significance: GDM cointegrates with gold prices with over 99% probability. Here I plot the difference between the spot prices of 6.1 troy ounce of gold and the GDM index multiplied by 3.68 (to compare with my earlier plot, I normalize the gold prices and the GDM index so that the Gold-GDM spread yields roughly the same dollar value as the GLD-GDX spread at any time):


The mean-reversion of this spread is even more obvious than my plot in the earlier article. Also, with the longer history, we get a much better feel for the range of fluctuations. While the value of the spread is about -$213 as of the close of Nov 9, it can certainly go much lower before reverting, based on the highs and lows of the last 3 years.
FOOTNOTE
A reader of my earlier article made an interesting comment about shorting ETF’s such as GDX and GLD. He argued that since ETF shares can be constantly created, it should not require existing shares to be borrowed for shorting. I asked Mr. Phillips of Van Eck Global about this, and he confirmed to me that a newer ETF like GDX can in fact be hard to borrow. He went on to say that the borrowing of ETF’s has nothing to do with the issuer. The issuer can indeed create an unlimited supply of the shares, but the trader still need to borrow them from his or her broker for shorting. He also told me he is currently working hard to eliminate any borrowing problems in GDX that may have existed.
Subscribe to:
Posts (Atom)


