0

An arbitrage trade between energy stocks and futures

With a lesson costing 6 billion dollars, Amaranth has taught us an, albeit disastrous, arbitrage trading technique in energy futures: buying the March-over-April spread in natural gas futures, and betting that it will increase in value. Unfortunately for Amaranth and its head trader Brian Hunter, the spread decreased rather than increased in September, resulting in a $6 billion drop in value. Many commentators breathed a sign of relief that this has caused no widespread disruptions in the financial market, reasoning that this is too obscure a corner in arbitrage trading to matter. However, as we learned in the Long Term Capital Management debacle, spreads in the financial markets often move in tandem, especially during times of market stress. Since mid-August, I have been following another obscure spread heading towards a 3-year low, and it may present a profitable trading opportunity.

As oil prices go to historic highs during this past year, energy stocks have followed a similar course. For example, front-month light sweet crude oil E-mini contract QM reached a historic intraday high of $78.30 on July 14, while the energy sector exchange-traded fund XLE reaches its historic intraday high of $60.15 on May 11. Since energy companies typically own rights to oil either above or under ground, it is reasonable that their stock prices follow the price of oil. In technical terms, we say that energy stock price “cointegrates” with the crude oil price, a concept pioneered by the Nobel laureates Robert Engle and Clive Granger. To prove that they do in fact cointegrate, I ran a Matlab cointegration package developed at University of Toledo in Ohio on the closing prices of QM (using a perpetual futures series) and XLE for the last 3 years. The program determined that they cointegrate with a 95% probabilty. Now, what this does not mean is that QM and XLE prices will always move up or down in a similar percentage everyday. This also doesn’t mean that there won’t be periods of time when the spreads between QM and XLE will go way out of sync, just as the gas futures spread did for Amaranth. What this tells us is that with high probability, the spread will eventually goes back to their historic average, and then probably goes in the opposite direction for a while.

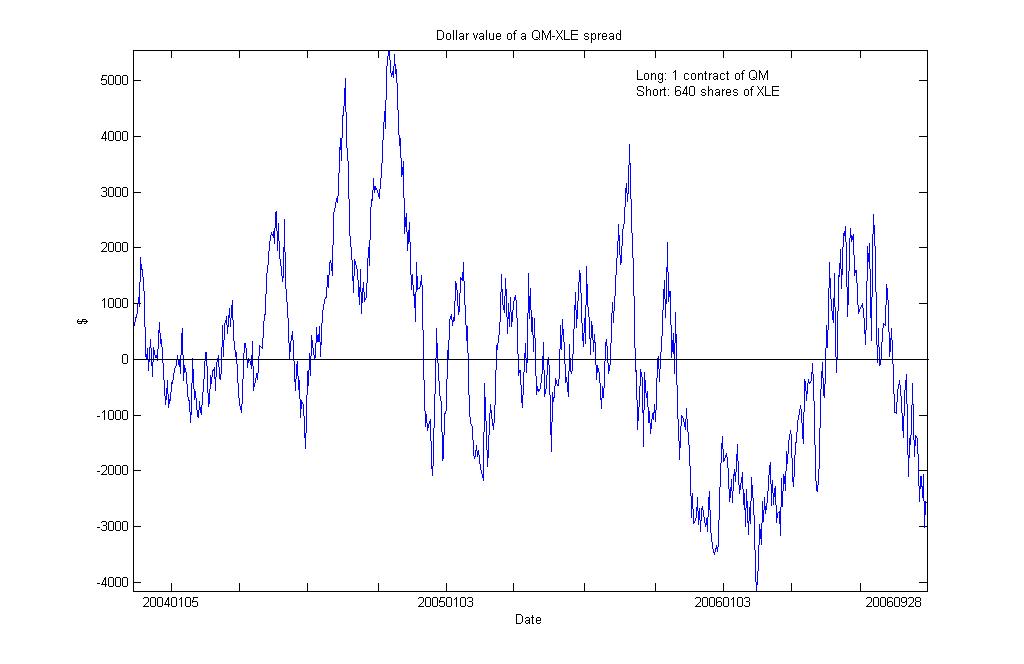
To illustrate this point, let’s take a look at a plot of the spreads between QM and XLE over the last 3 years. (Click on the graph twice to enlarge it.) Suppose we are long a front-month QM contract (rolling over the contract every month), and are simultaneously short 640 shares of XLE. The number of shares is determined by the Matlab package mentioned above. The y-axis shows the dollar value of this pair of positions. We can see that in the past 3 years, the value went as high as $5,550 on October 14th, 2004, and as low as -$4,152 on February 16th, 2006. The average is $57, which is almost zero. As of this writing (at the close of September 28, 2006), the value is -$2,584. While this is not near the 3-year low yet, it is getting there. Those who have a strong stomach will buy this spread now, and hope that the value will move back up to it long-run average of near zero. (Click on the graph twice to enlarge it.)

Some people may feel uneasy about trading oil futures because they have to keep rolling over to the next nearby contract every month, or maybe their brokerage doesn’t allow futures trading at all. There is now a convenient alternative: an exchange-traded fund called USO. This fund trades like a stock on the American Stock Exchange, just like XLE. USO closely reflects the value of the nearby contracts in crude oil (with a small percentage that reflects the value of other energy futures such as natural gas or heating oil). And yes, I have checked that it cointegrates equally well, if not better, with XLE.

Some thoughtful readers may wonder whether there are any fundamental reason energy stocks have dropped much less in value since the summer than energy futures prices. Now energy companies are valued much like any other companies: roughly speaking, their stock is worth the present value of their anticipated future cash-flow plus their current net asset value. The current net asset value certainly should follow the front-month crude oil contracts very closely, in fact, more closely than their stock price. However, their anticipated future cash-flow reflects the expected price of oil in the years to come, not the current cash price of oil. (For those readers who enjoy a bit of exercise, they can look up the oil contracts that expire in 2007, 2008 and beyond to see if they in fact has higher prices than the front contract.) At this time, the stock (and futures) market is telling us this: oil price will go back up in the future.


0

How To Advertise

Thank you for your interest in advertising on Quantitative Trading. We have approximately 5000 unique visitors that view 11,000 pages per month. Engage our valuable demographic of highly educated and affluent readers through multiple placement options including premium display, buttons and links, email and newsletters, co-registration and lead generation, sponsorships, home page takeovers and other creative advertising solutions.

Available Ad Sizes: 728x90, 300x250, 160x600, and 88x31.

InvestingChannel is one of the fastest growing financial media companies and is our exclusive advertising partner. With InvestingChannel’s seasoned team of professionals, you can optimize your campaigns to maximize return on investment with the highest level of service.

To learn more about advertising on Quantitative Trading contact InvestingChannel at:

advertiser@investingchannel.com

(p) 646.467.7824

(f) 646.290.8452
www.investingchannel.com


0

A “Highly Improbable” Event?

A historical analysis of the natural gas spread trade that bought down Amaranth

Nick Maouis, the founder of Amaranth, claims that the 6-billion dollar loss that his fund suffers is due to a “highly improbable” event in the natural gas market. Some analysts have thrown doubts on this claim. To see how improbable this loss is, let’s take a quick look at the historical performance of this trade since 2000. This is not only of forensic (and perhaps legal) interest: if Mr. Maouis’ claim were true, it would have furnished us a glimpse of a potentially highly profitable trading strategy.

The bet that Amaranth and its head trader Brian Hunter made is that the March-over-April spread in natural gas futures will increase in value throughout the year prior to the contract expiration. Unfortunately for their investors, the spread decreases rather than increases in September, resulting in a $6 billion drop in value. We don’t know the exact time when Amaranth bought this spread. However, it is likely that they have started buying in April of this year. April is the time when the nation’s natural gas storage inventory coming out of the winter is known and thus provides a foundation to bet on next winter’s natural gas sufficiency. I plotted below the profit-or-loss of buying this spread (long one March contract of the following year, and short one April contract) in April and exiting the position at the end of September every year since 2000. (Click on the graph twice to make it bigger.)


To my surprise, this trade loses money 3 out of 6 previous years. The one year that this trade was very profitable is 2005: it made more than $16,000 profit per pair of contracts. This is consistent with a Wall Street Journal report that Mr. Hunter made $1 billion for Amaranth in 2005. That was indeed due to an improbable event last year: Hurricane Katrina.

Note also from the 2006 graph that, consistent with news reports, the trade was actually quite profitable up till the beginning of September. This paper profit may not be easily realized by Mr. Hunter though, since a lot of it may be due to his aggressively increasing his position and driving up the market.

Now there can be several objections to my analysis. You might think that if we hold on to this spread position longer, say till December, it would have been more profitable historically. My research shows otherwise. Holding till December would have resulted in losing 4 out of the previous 5 years, losing even in 2005. You might also argue that this is an extremely simplistic version of Mr. Hunter’s strategy. No doubt Mr. Hunter used various complex options strategies, continuously adjusted with various fundamental factors such as weather prediction and natural gas inventory reports as inputs. However, from a risk management point of view, the portfolio that Mr. Hunter owns seems highly correlated to a plain vanilla spread position that I described. The fact that this plain vanilla position loses money half the time historically would not have been reassuring.

In a future article, I will describe some calendar spread trades in energy futures that do have a much better profit consistency.

 
Copyright © Stock Strategies Blog

The "Urban Elements" theme by: Press75.com

Blogger templates